Who makes what, and what you can actually second-source
When an AI build is a year late, the review rarely finds a GPU problem. It finds a transformer. A supply chain can be mapped in dollars or in lead times, and almost everyone plans with the dollar map.
A post-mortem with a strange culprit
A gigawatt-class campus is a year late for its energization date, and the team starts a retrospective. The GPUs arrived early and sat in a warehouse, depreciating. The construction finished on time. The tenants signed their contracts.
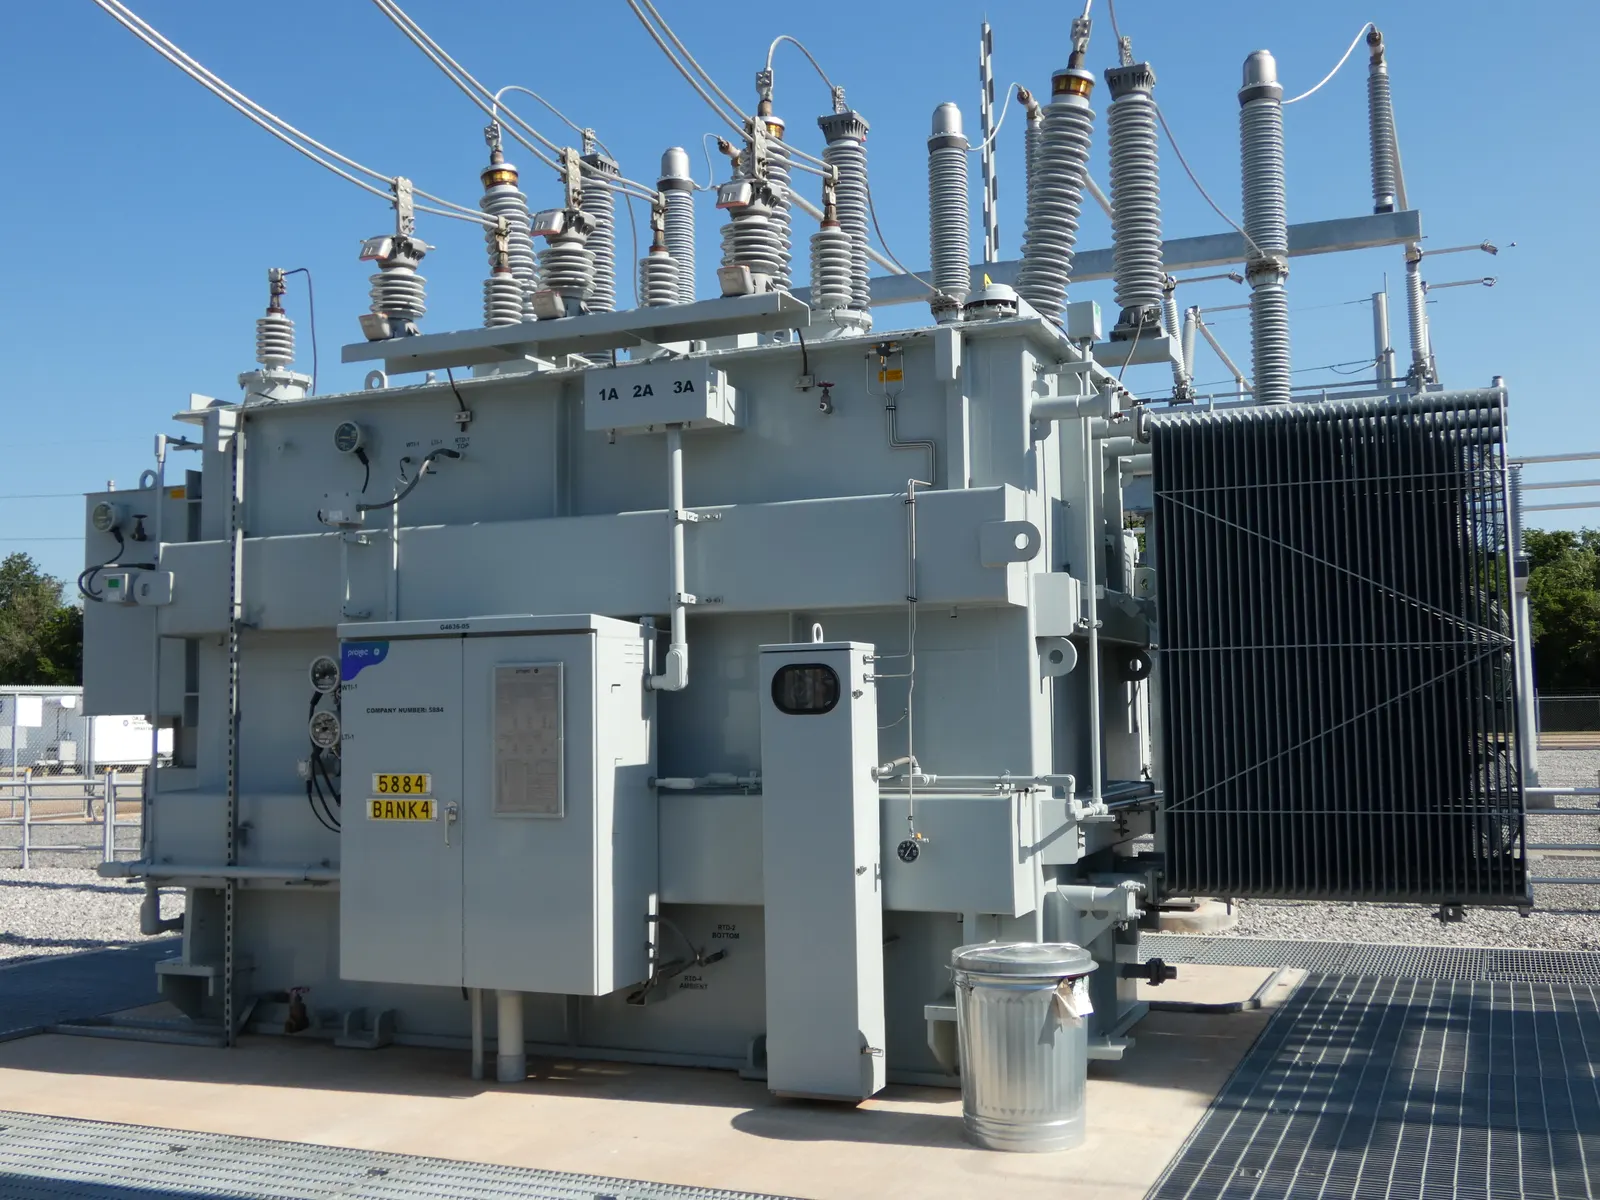
Then someone traces the critical path. The item on it is a stack of steel boxes full of oil and copper windings: substation transformers. The order sits with a vendor whose queue is now three years long. Industry surveys suggest that this is not one unlucky case. Something like 30 to 50 percent of 2026 builds face delay from exactly this cause.
These stories almost always start from the same mistake. The team planned with the cost map. On this map, an AI data center is mostly a GPU purchase. Bernstein puts accelerators at 39 percent of total capex, and NVIDIA’s gross profit alone near 29 percent of everything. On that map, the GPU deserves all the attention.
But schedules do not follow the cost map. They follow the lead-time map, and the two maps are almost inversions of each other. Vendors can deliver a gigawatt of accelerators within a year. Some of the cheapest items in the build cannot arrive that fast.
The rest of this essay draws the lead-time map, one layer at a time. It is worth one careful pass, because it changes what “supply chain risk” means. The question is not who charges most, but who can say no.
The build, layer by layer
Select a row to see who supplies it, what it is waiting on, and whether a second source is realistic. Bar length is the reported lead time; color is how hard that layer is to second-source.
- Not sourceable
- Hard
- Workable
- Straightforward
What it is
Permission and physical connection to draw power from the grid.
Suppliers: One source
The incumbent utility. There is no second source and no supplier to negotiate with.
Lead time
4–7 years in most US markets, per Lawrence Berkeley National Laboratory data. ERCOT’s large-load queue was near 410 GW in April 2026, about 87% of it data centers.
How to buy it
This is the only layer with no procurement strategy at all. It is why an already-energized site commands a reported $3–4M per MW for each year of lead time, and why site selection is really interconnect selection.
Showing 10 of 10 layers.
Three layers where no one can say yes
Start with the layers where second-sourcing is structurally impossible. Identifying them early saves whole quarters of wasted negotiation.
The purest case is the utility interconnect. Every site has exactly one grid operator, and that operator does not compete for the business. The queue is four to seven years in most US markets. ERCOT’s queue alone held about 410 gigawatts of requests in April 2026, and close to ninety percent of it was data centers. There is no procurement strategy here. There is only a siting strategy.
The siting strategy explains a price that would otherwise look absurd. An already-energized site commands three to four million dollars per megawatt per year of lead time, only because it exists.
Compare that price with what a populated megawatt earns. On reservation terms like the Memphis contract, that is on the order of $50 million a year. So the market pays about seven percent of a year’s revenue to start a year sooner. If anything, the price looks cheap. The retrofit economy depends on that number.
The second layer is the accelerator itself. Here the barrier is the software stack on top of it, not the market share. Bernstein sizes the credible alternative, Broadcom and AMD together, at 15 to 20 billion dollars of addressable content per gigawatt. That is real money, but it is not a substitute. The practical strategy is to split by workload, not to pretend that one fleet can be dual-sourced.
You never purchase the third layer directly. It is high-bandwidth memory (HBM), which arrives inside the accelerator. It is sold out at all three of its makers. SK hynix leads, with published shares anywhere from 50 to 62 percent depending on the count. It also holds roughly two-thirds of HBM4 orders for the Rubin generation.
Keep the range, not an average. The disagreement between the counts itself shows how opaque this layer is. Projections show HBM4 shares moving toward something like 50/30/20. This is the one genuine change coming, and it is the first real competition in this layer.
The layer that kills schedules
Now look at the layer that the post-mortem found. Read its numbers slowly.
Generator step-up transformers average 144 weeks. Industry reporting puts substation transformers at about 140 weeks in 2023 and more than 160 in 2026. The largest units take four years. The sources do not agree on one number. Some procurement surveys report shorter waits for substation units. The figure depends on the unit class and on who counts, so plan on the long end of the range.
Medium-voltage switchgear takes 50 to 80 weeks, and reports say it is sold out through 2028. Cummins is sold out of high-horsepower generators through 2028. ABB, Schneider Electric, Vertiv and Eaton are major suppliers of switchgear and UPS systems. All four added capacity, and demand grew faster than all of it. Projections show the US market for this equipment tripling by 2030. They show transformer demand going from about 1,500 units a year to more than 9,000.
Two structural details make it worse than one long queue. First, the slots do not come together. A turbine deliverable in 2027 is worthless without a transformer slot to match. You book the two with different vendors, on different schedules. So the real skill is to synchronize queues, not to pick suppliers.
Second, redundancy multiplies the order. 2N means two of everything electrical. So a topology chosen for reliability quietly doubles a three-year order. Teams price redundancy as capex. It is also, and sometimes mainly, a schedule decision.
Even the alternative route has the same problem. Some developers plan to go behind the meter, which means that they generate their own power on site. The developers of roughly 101 gigawatts of announced capacity now intend to do this. It replaces the utility queue with the turbine queue, and turbine makers already allocated their slots through 2029.
Where a buyer still has hands
Two layers behave differently. If you know them, your negotiating posture changes completely.
Liquid cooling is the least concentrated market in the entire build. The top five vendors together hold only about 35 percent. Vertiv leads at just over 11, and a long tail follows. One part of it is the coolant distribution unit (CDU). Persistence Market Research projects CDU sales to grow from about 1.9 billion dollars in 2026 to 6.1 billion by 2033. In a fragmented, growing market, buyers set the terms.
This advantage is decreasing in the usual way, through acquisitions. Schneider bought Motivair, and Trane agreed to buy LiquidStack. Qualify a second cooling vendor while there are still enough of them for the word “second” to mean something.
Optical transceivers are the one layer that already works the way textbooks say procurement should. Large operators qualify two or three vendors per speed grade. They use multi-year agreements with price locks and allocation guarantees. The vendor positions look like this:
- InnoLight leads 800G at around 35 percent.
- Eoptolink is in the top five.
- Together, the two hold about 60 percent of NVIDIA’s incremental orders.
- Coherent, Lumentum and Broadcom share the rest.
If every layer looked like this one, this article would not exist.
The trap inside the good layer
But the good layer contains the best trap, and the trap applies to other layers too.
Qualify three transceiver vendors, and the slide says “diversified.” Open the modules, and each one contains a PAM4 DSP (the digital signal processor that encodes and recovers the signal). Marvell and Broadcom supply most of them, and Credo arrives at 1.6T.
The lasers inside come from the EML (electro-absorption modulated laser) market. There, three firms hold about 72 percent, per TrendForce: Lumentum, Broadcom and Mitsubishi Electric. Three vendor names, one supplier. The diversification was real at the layer you checked and illusory at the layer you did not.
The same layer carries the risk that no purchase order can hedge: policy. Chinese vendors hold seven of the top ten module positions. A proposed FCC restriction would change the sourcing map overnight. Inventory does not help, but qualification does, because qualification takes months and rule changes take effect immediately. Keep one non-Chinese vendor certified per speed grade. This is insurance, and you pay for it in engineering time.
Reading a supply chain twice
The practical order of operations follows from everything above, almost mechanically:
- Secure the interconnect before anything, and let it choose the site.
- Book transformers and switchgear before the design is final. At up to 160 weeks, the change orders are cheaper than the wait.
- Decide redundancy early, and remember that it doubles the scarcest queue.
- Use the cooling market while it is still fragmented.
- Run two or three optics vendors per speed grade, and audit what is inside them.
But the lesson you can use elsewhere is the two maps. You can draw any complex supply chain by dollars or by lead times, and the two drawings rarely agree. The dollar map shows where your money goes. Financial reviews reward that answer, so teams make that map. The lead-time map shows when anything can actually happen. Teams usually sketch it only after something failed to happen.
Draw it first. On this chain, it shows a strong contrast. The industry’s costliest component ships in months. Its cheapest structural parts (oil, steel and copper wound the old way) set the pace of the entire artificial intelligence build-out.
What to take away
- Plan on the lead-time map, not the cost map. GPUs are 39 percent of the money and almost none of the schedule risk.
- Three layers have no second source at any price: the interconnect, the accelerator’s software stack, and the memory inside it. Strategy there is siting and workload-splitting, not negotiation.
- Transformers and switchgear, with transformer waits reported at 140 to 160 weeks and more, are where builds actually fail. Book them before the design is final, and remember that 2N doubles the order.
- Cooling is the buyer’s market, and it is consolidating. Optics is the model layer, but it hides a DSP duopoly one level down. Check inside.
- When a supply chain surprises you, you were probably reading the wrong map.